Reports
The system contains a powerful and flexible reporting tool that can highlight products, meeting certain predefined criteria or items that are in some way exceptions and need to be handled manually or in a specific way. Dynamic lists are presented when certain criteria are met, e.g. potential stock outs, overdue orders, overstocked items, under stocked items, items with high forecasting errors etc.
Advanced users can define their own criteria by writing SQL statements in an advanced filter, which is included in the system. The Advanced Filter is also used to compare two parameters against each other, i.e. days in stock < delivery time.
See the Common Reports Guide to view examples of standard reports within the AGR system.
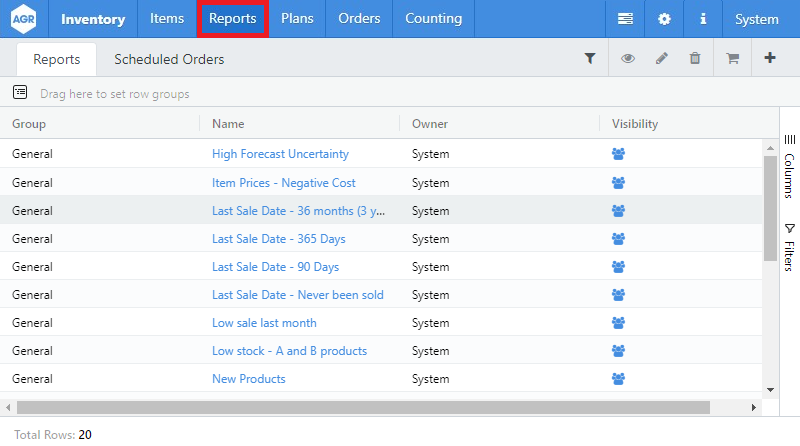
Below is a typical view of the Reports tab.
Creating a New Report
Creating a report within the AGR system is easy and helps the user to organize items within the system for eventual ordering. From the navigation bar, click on Reports, and then click on the + on the right side of the toolbar to build your own report.
Once you click on the +, a new window will appear:

In this new window, you have to fill in the name, description, group, visibility, and any labels that you want for this report.
You will then see the view for your report with the default Item no. and Location columns. There will be no filters so the report will include all the items within your system. In order to see what you want within this report, you have to include the appropriate filters that will ‘filter out’ only the items that you wish to view. For a list of filters that are often used for common reports, please see the Common Reports Guide.
Viewing Reports
To access the reporting tool choose Reports at the top of the Navigation bar. A new view will then open below showing all the reports currently held in the system. Click on a report to see more details. In the report list the following details are shown for each report:
- Group: What group that specific report belongs to.
- Name: The name of the report.
- Description: Description of the report’s contents. The description is written by the user when the report is created, can be edited at any time, and should reflect the limitations of the report.
- Owner: The person who created the report.
- Visibility: Who can see this report.
View Settings
It is possible to open the view settings within Reports by selecting any line and choosing the View Settings button.

When this is selected, the view settings panel will open, allowing the user to decide what columns to show, what filters to use, and by which column heading the information is being grouped. For example you could group all the information by Item Number, Colour, etc. Below is a picture of the View Settings sidebar for a Report on Overstock Items.

Below is a table of all common grid commands to help you get the most out of the view settings. These settings are the same in the Report Details, Orders, and Plans modules.
| Keyboard Command | What It Does |
|---|---|
| Space bar | Selects a line |
| Holding shift and clicking on multiple columns | Creating a hierarchy as to how to gropu the information. F.ex. Shift and clicking on Location column and Color column will first sort your information by Location and then by color. |
| Arrow Keys | Navigate up, down, left, and right between cells in the grid |
| Select a group and Enter key | This will automatically expand or collapse the group |
Editing Reports
By clicking on the edit button in the report details, it is possible to edit previously saved reports.

The system then opens an edit mode for that report as shown below. It is possible to change the description, group, report visibility, columns that should be visible or to add any filters and calculated fields.
Export to Excel
It is possible to export all reports to excel or to .csv format. This is done by selecting the Export to Excel button on the right side of the open report and choosing either Excel Export or CSV Export. The same report in Excel view has the same columns and same information.

The same report in excel:

It is also possible to select, right click and copy values from Reports and Orders directly.